Skip to main content
Contact Us
Search:
Search
Toggle navigation
Home
About
Staff
History
Partners
FAQs
Contact Us
Governance
Board Meetings
Board Members
District Boundaries
Transparency
Financials
Policies
Programs and Services
Drone Seeding
Cost-Shares
Local Cost Share
Central MN River Watershed Project (CMRWP) Cost Share
Cover Crop Vendors
Ducks Unlimited
Minnesota Buffer Law
Easements
Conservation Easements (RIM)
MN Conservation Reserve Enhancement Program (CREP)
Local Government Road Wetlands Replacement Program (LGRWRP)
Structural Practices
Ag Inspector
Noxious Weeds
Pesticide Applicator Testing
Equipment Rental
Wetland Conservation Act (WCA)
MN Agricultural Water Quality Certification Program (MAWQCP)
One Watershed, One Plan
Central Minnesota River Watershed Partnership
South Fork Crow River
South Fork Crow River Management Committee Meetings
Lower Minnesota River West
Media
Podcast
Videos
Events
Email or Text Alerts for Events
Calendar
Education & Outreach
Outstanding Conservationist
Cover Crop Termination Guidelines
Rain Gardens
LMRW CWMP Public Hearing
Newsletters
Educational Activities
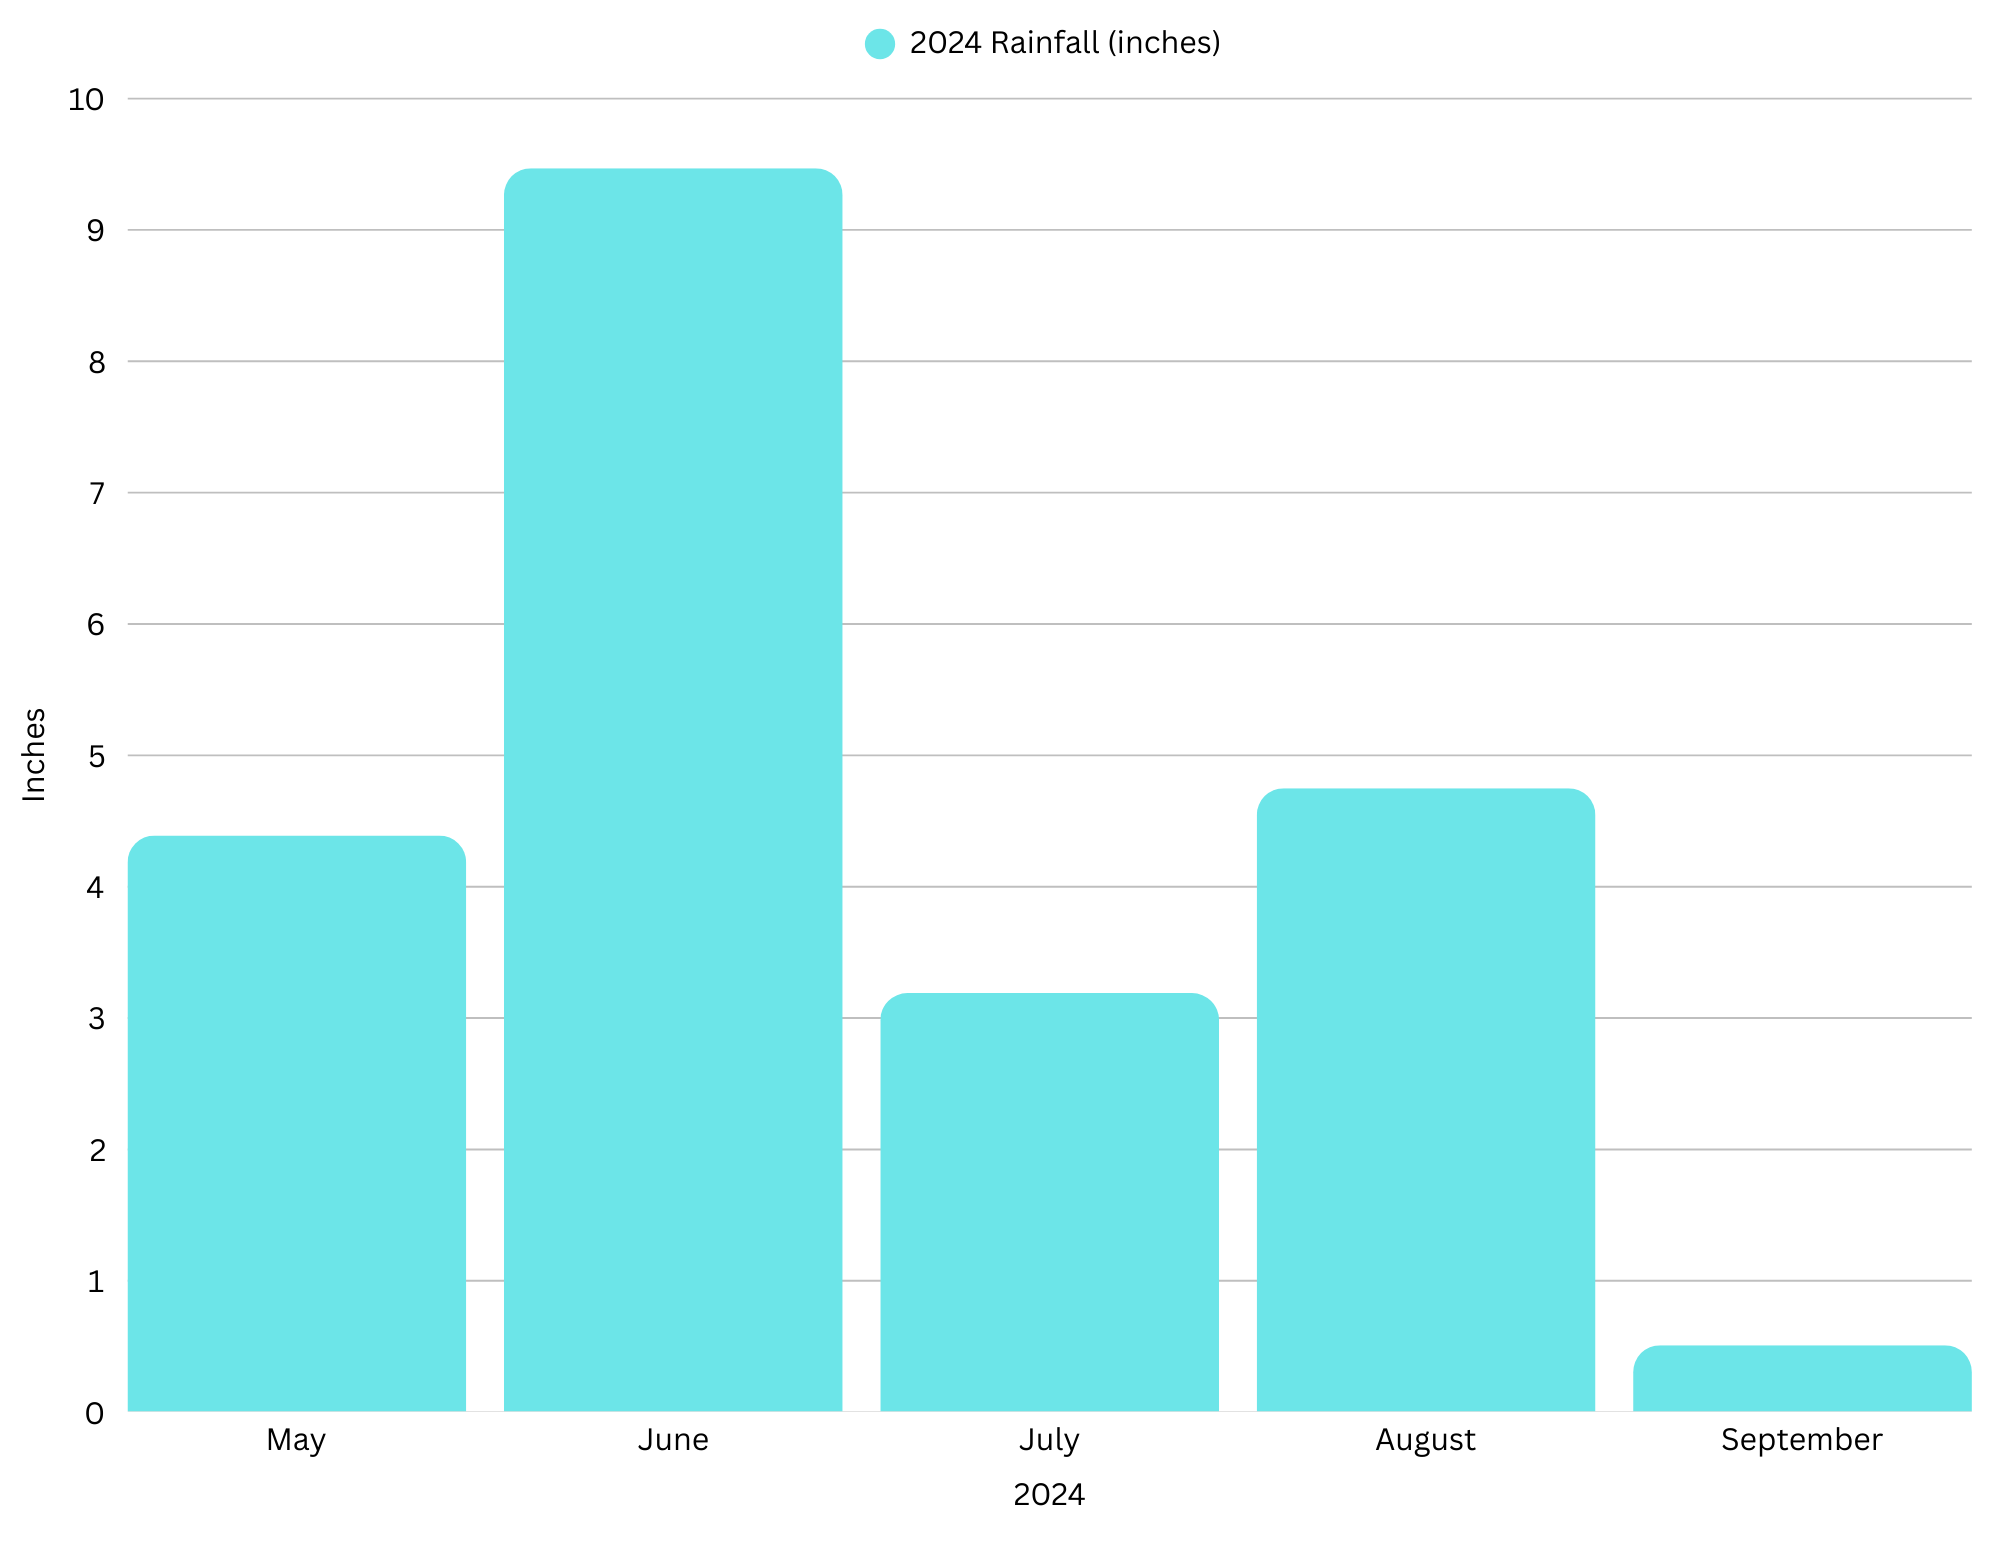
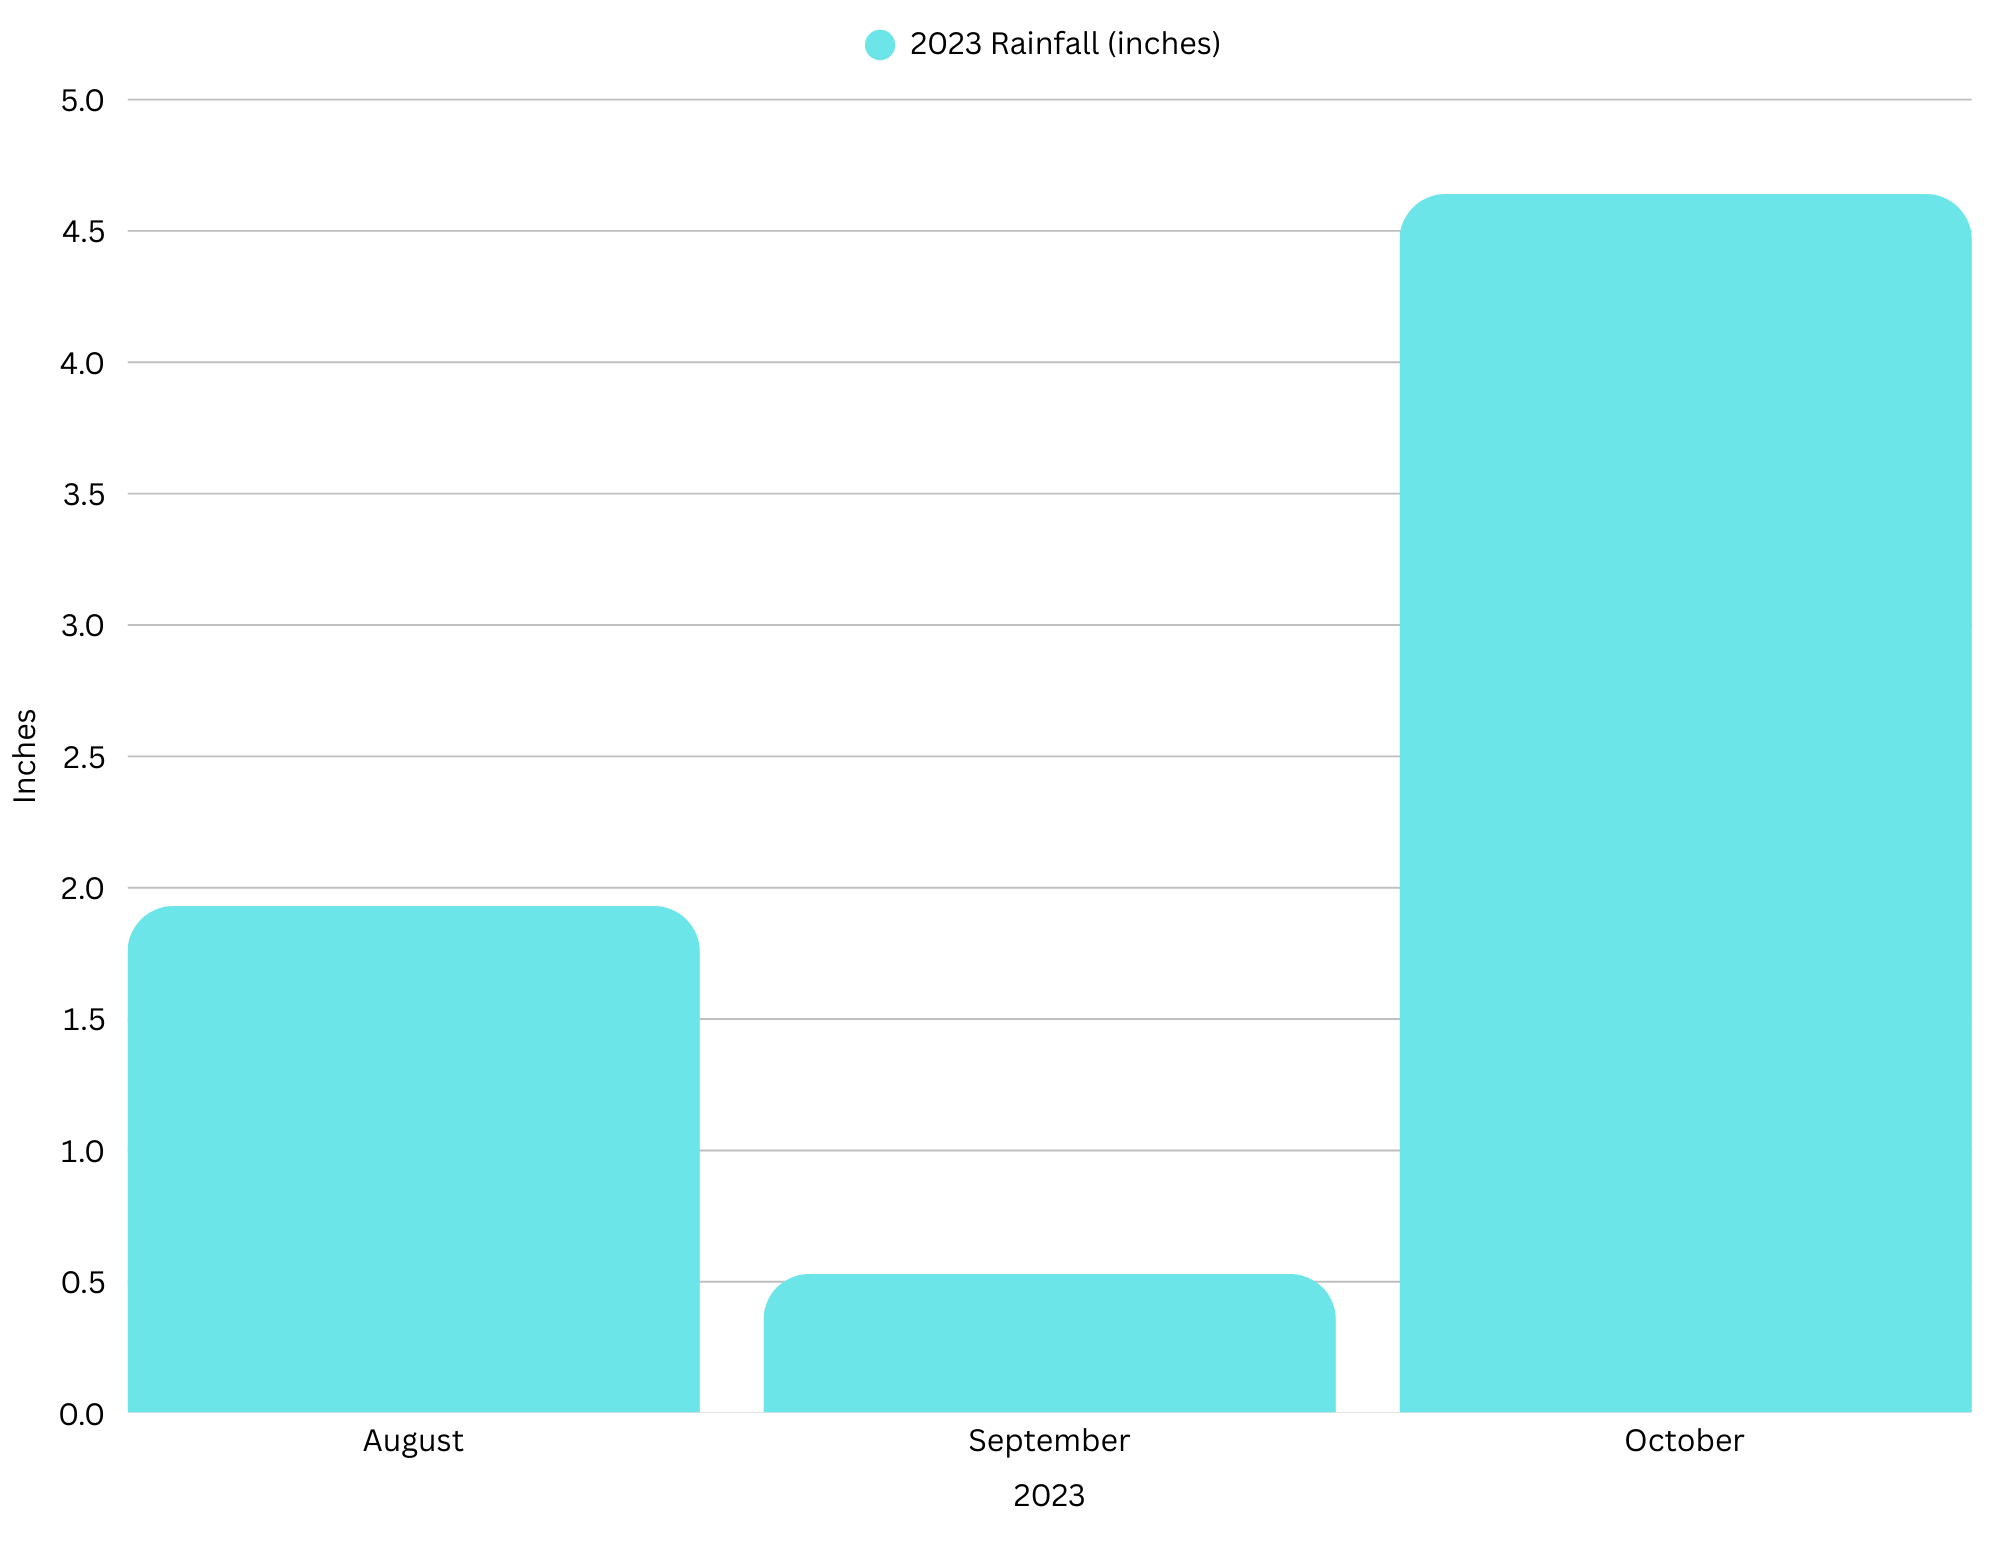
Precipitation Observer & Rain Data
Rain Data
×
Search results
Search
Search